
Performance Profiling and Debugging
Intro
Profiling and Debugging are complementary techniques used to discover facts about what a given system is doing and the performance characteristics of those actions’ . We will focus on .net debugging and profiling here, but in any given system typically uses databases, OS level services etc, and therefore you will probably need to debug or profile these systems as well. Profiling and debugging is huge areas, so this piece is focused on practical usage.
Debugging .net
Both .net (core) and .net Framework have extensive support for debugging. These tools can attach to a running process so you can step through the code as is runs. What detail you see are dependent on the build artifacts (debug vs release, symbols etc) You are not only limited to running processes. You can also open a memory dump, and these dumps can be taken by a range of tools. Finally Dotnet-trace can also connect to a running process, but as the name suggest only tracing the process.
Tools
- Visual Studio
- VS Code
- Rider, dotTrace, dotMemory
- ANTS Profiler /ANTS Memory Profiler
- WinDBG /WinDbg Preview
- Dotnet-dump / Dotnet-trace
- Remote Debugger
- …
Scenario: Exceptions being thrown by production system.
- (If Permitted ) Get a memory dump. A memory dump will contain threads, stacks of treads, and heaps. All of these will both be managed and native, but our focus will be on the managed/.net side.
Alternatively, most IDEs support remote debugging. NB Secure this channel!
-
Start with Exception analysis.
!analyze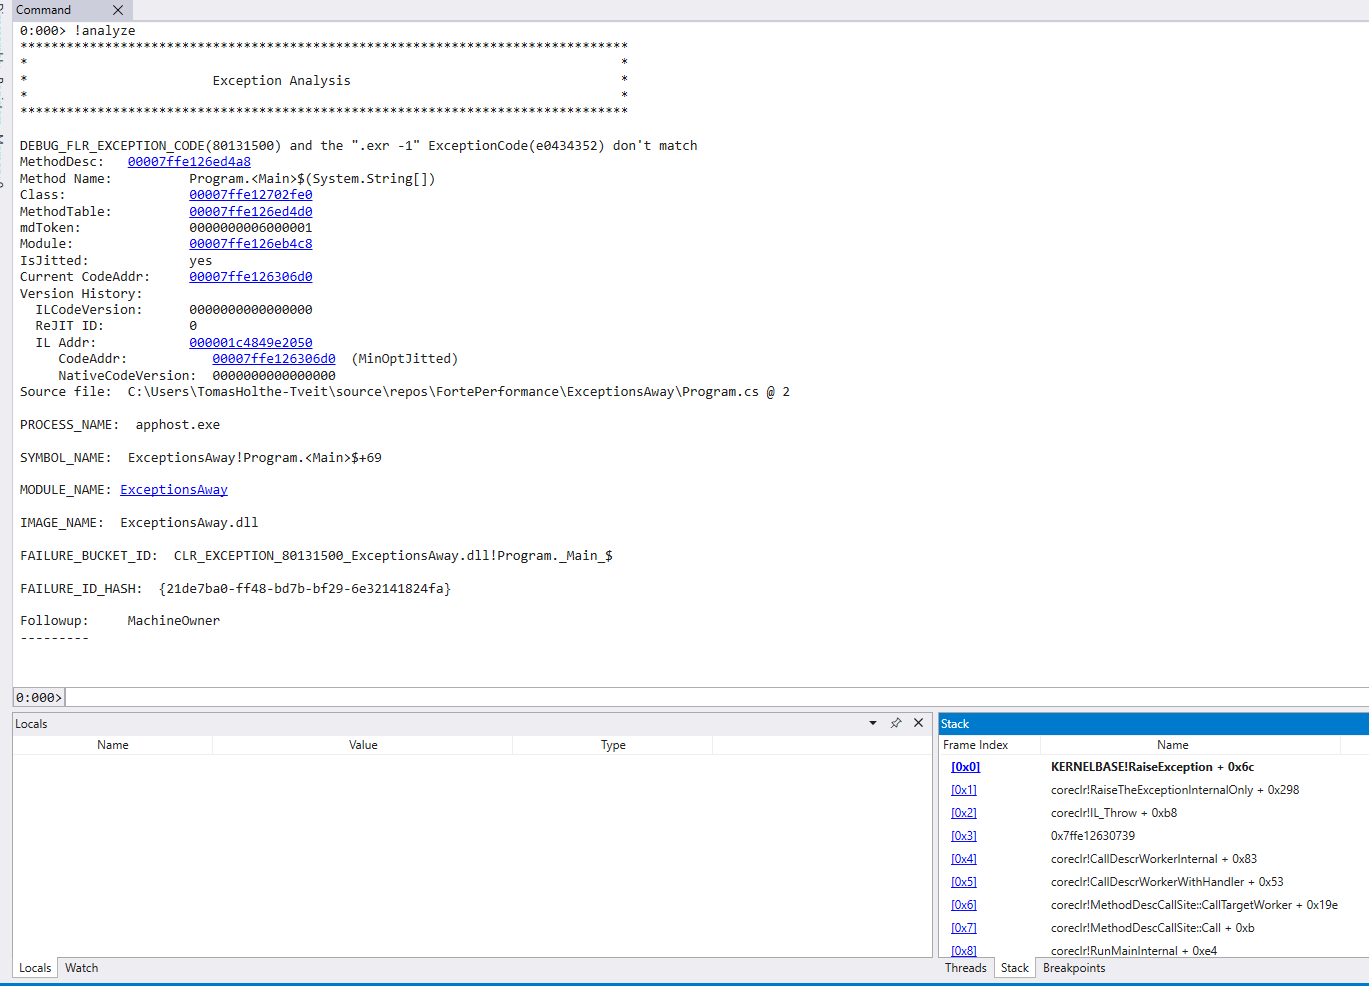
.foreach (ex {!dumpheap -type Exception -short}){.echo "********************************";!pe ${ex} } -
Start with listing the current stacks. A good start hypothesis is that the active stacks in the dump will have recorded a hang. Check this out before moving on.
~* e !clrstackLists stacks for all threads.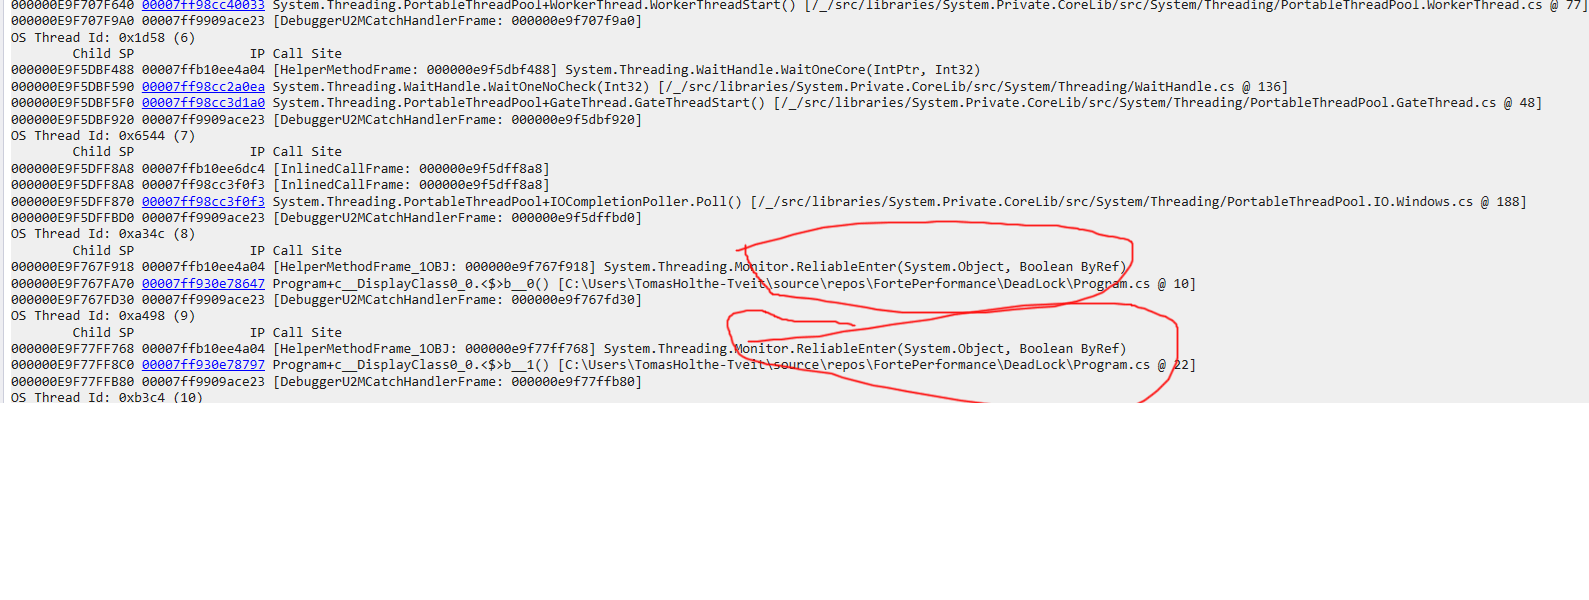
-
Your tool of choice may also automate checks for know issues like deadlocks. For WinDbg you can run
!SyncBlk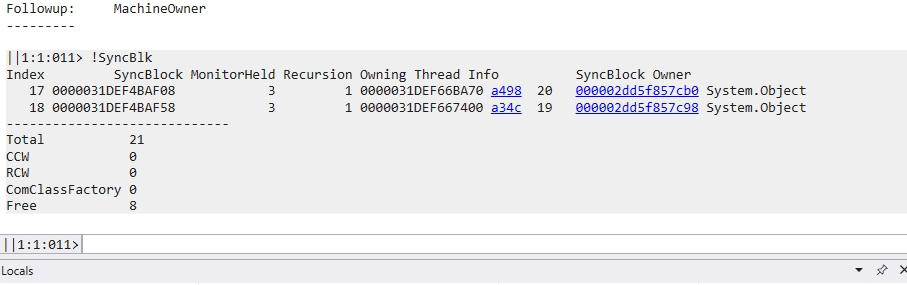
-
Check runaway threads
!runaway!threadpool
Profiling
Profiling is looking at how a system operates. This is typically used for performance reasons, as we assume that the behavior is as designed. Any code is generally either IO or CPU bound. Profiles may help you with both, but there are often differences in the tools and methods to profile between then. E.g. Jetbrains has dotTrace and dotMemory.
CPU Bound profiling
Here we typically look at algorithmic problems, measure and identify hotspots in the code. This can either be local or remote. Keep in mind that some profile methods may be very intrusive performance wise. This may not be acceptable in a production setting!
Memory Bound profiling
In managed/garbage collected runtimes like .net the memory is managed by the runtime, and as such you can only have a native memory leak. Such a leak can e.g. be a SqlConnection, File handle etc. Typically, a “leak” in .net is rather that something is holding on to a reference, and it is thus not collected. There is also another category that looks like a leak: not yet collected objects.
Very simplified: class object instances are allocated on the heap while value objects are on the stack. Also, while strings have some value like behavior, remember that they are stored on the heap, and any modification (substring etc) is in fact a copy, and may exist on the heap for an extended time period.
https://www.jetbrains.com/help/dotmemory/NET_Memory_Management_Concepts.html
Garbage Collector (GC) is the part of the .NET framework that allocates and releases memory for your .NET applications.
When a new process is started, the runtime reserves a region of address space for the process called the managed heap.
Objects are allocated in the heap contiguously one after another.
Memory allocation is a very fast process as it is just the adding of a value to a pointer.
Any object larger than 85KB are store separately on the Large Object Heap (LOH). This is not compacted during normal garbage collection. The LOH will thus get fragmented over time.
Finding your roots
A key factor in memory pressure is holding on to references as short as possible. The sooner the last reference to an object is released the quicker an object can be garbage collected. Be cautious when adding delegates, event handlers etc to global or static scoped objects or methods. NB This also includes what singleton scoped dependency that is injected into your code. Most unwanted memory is due to this.
!DumpHeap -stat
!DumpHeap -stat -type SomeType.OrAnother
Rent, not allocate
For large allocation it will typically be much faster both on allocation as well as collection to rent an array from ArrayPool/ArrayPool.Shared. There are also more advanced allocation schemas that can be used like an Arena Allocator

Measure
Measure using Benchmarkdotnet, Rider Dynamic Program Analysis, DotMemory, Visual Studio etc. Go for large and frequent allocations and iterate.